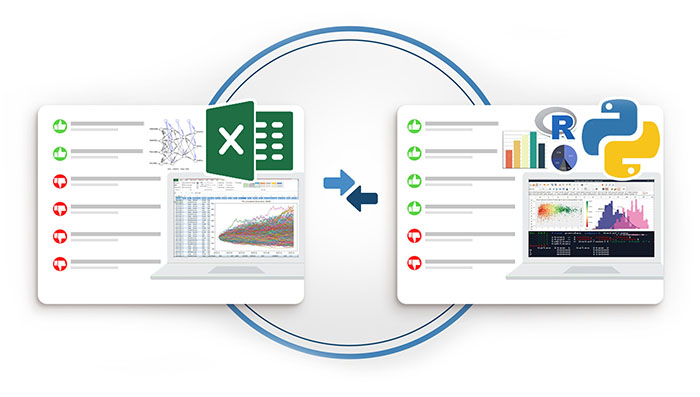
Why Actuaries Are Transitioning From Excel
As an actuary, you know the importance of managing large sets of data and making accurate predictions. Excel has been a valuable tool in this process, but as data sets grow larger and more complex, it can become unwieldy to handle. This is why many actuaries are now transitioning to more advanced technologies that can help streamline their workflow and provide more sophisticated analysis capabilities.


Benefits and Limitations of Excel
Excel has been a reliable tool for many years, offering the ability to organize, analyze and make critical decisions with data. It is user-friendly and widely accessible. However, as data sets become larger and more complex, the limitations of Excel can become more apparent. Excel is prone to errors, with larger and more complex data sets. In addition, Excel has limited data visualization and analysis capabilities, making it difficult to identify patterns and trends in the data.

Challenges of Siloed Data
Siloed data is a significant challenge that many actuaries face when using Excel. Data silos occur when data is stored in separate systems, making it difficult to combine data sets for analysis. For example, actuarial data may be stored in separate Excel spreadsheets or databases, and consolidating this data can be time-consuming and prone to errors. Siloed data can also make it difficult to identify patterns and trends in the data, which can hinder predictive modeling and decision-making.

Examples of Models That Excel Can’t Handle
There are a few models that Excel can’t handle due to increasing complexity. This model requires large amounts of data and complex algorithms, which can quickly become unwieldy to handle in Excel.
Another example is the Neural Network model, which is used in predictive modeling to simulate the behavior of the human brain. This model requires sophisticated algorithms and large amounts of data, which can be difficult to manage in Excel. With more advanced technologies, actuaries can easily work with these models, providing more accurate predictions and insights.

Pathway to Transition
If you are considering transitioning away from Excel, it is essential to have a plan in place. This plan should include the following steps:

By carefully planning your transition and considering various technology options like R, Python, KNIME, and Power BI, you can confidently move away from Excel and take advantage of more advanced tools to improve your workflow and provide more sophisticated analysis capabilities.
Identify areas where more advanced technologies can help improve your workflow and address the limitations of Excel.
Organize your data to make it easier to transition to new technologies. This may involve consolidating data from different sources and ensuring the data is clean and well-structured.
Research and evaluate technology options that best suit your needs. In addition to R and Python, consider alternatives like KNIME and Power BI. These tools offer advanced data analysis and visualization capabilities and can handle large and complex data sets.
- R and Python are widely used programming languages in data analysis, statistical modeling, and machine learning, offering powerful analytical capabilities and extensive libraries.
- KNIME is an open-source data analytics platform with a user-friendly, visual interface, enabling users to create data workflows and leverage pre-built nodes for data manipulation, statistical modeling, and machine learning.
- Power BI is a business analytics tool that integrates seamlessly with Excel, allowing users to create interactive visualizations and reports from various data sources while enhancing their data analysis and visualization skills.
Invest in training opportunities for you and your team to ensure everyone is prepared for the change. This can include attending workshops, webinars, or enrolling in online courses to learn the new tools and technologies.
Develop a timeline for the transition, including milestones and goals for each stage of the process.
Conclusion
Transitioning from Excel to more advanced technologies can help improve your workflow and provide more sophisticated analysis capabilities. With the increasing complexity of actuarial data, it is essential to have the right tools and technologies in place to make accurate predictions and informed decisions. By identifying areas where more advanced technologies can help improve your workflow and organizing your data making it easier to transition, you can confidently move away from Excel and take advantage.
Ready to take the next step in your actuarial data analysis journey? Contact our team of experts for personalized guidance on transitioning from Excel to advanced tools like R, Python, KNIME, or Power BI. We’re here to help you make an informed decision and ensure a smooth transition for you and your team.
Only then will the silver linings be visible.
Questions? Call 719-581-2221 anytime to arrange a consultation with either author. Both have spent a decade or more helping associations grow, can share with you what’s worked, and would love your feedback.
